Turning the Sustainability Reporting Process into a Meaningful Experience
Back in high school and college, writing a report was a relatively simple task. Pick a subject, do a little research, punch out a few pages. Done! The task was always about the final product- the grade.
Sustainability reporting is much more than just a task; it’s a long-term process. And the payoff is in the process itself, not the product. Whether you are just beginning on the Corporate Sustainability Report journey or are a reporting expert, following this basic reporting process provides a meaningful experience for all stakeholders.
Engage the Audience
Engaging your audience starts with identifying your primary stakeholder groups. Stakeholders are people that can either affect your organization’s performance or are affected by your organization. These groups can vary widely depending on your organization’s mission. Typical stakeholder groups include the organization’s employees (or members), clients, vendors, shareholders, and the local community. Once you’ve identified and prioritized your stakeholder groups- open the conversation.
Engagement Isn't The Same For Every Stakeholder Group
It’s important to consider
- What to ask
- How to engage
- Frequency of engagement
There Are Many Ways To Engage The Audience
Since communication preferences vary among the groups, utilizing multiple channels of engagement enhance the experience. Remember to include both one- and two-way communication channels. Examples include:
- Survey
- Meetings
- Focus Groups
- Trade Associations
- Social Media
- Committees
- Training
- Communication
Frequency Is Also Important
It is NOT one and done. Consider offering routine events, like a quarterly webinar, as well as open-ended opportunities like a social media page. Providing convenient access tells your audience that you value their insight.
The objective here is to identify the issues that are important to each stakeholder group. Try to learn about expectations on reporting topics, get feedback on policies and programs, ask for ideas to improve. The best results happen when this process is honest and transparent. Come to the conversation with an open mind and open ears. The results may surprise you.
Focus on What Matters
Your engagement efforts have produced a long list of topics and potential issues on which to report. That can be overwhelming. The next step is likely the most difficult. But hang in there, it is also the most fruitful.
The objective here is to align your organization’s reporting efforts with the stakeholder goals and expectations identified through the engagement process. Following an accepted reporting standard simplifies this exercise. The Global Reporting Initiative (GRI) provides an international sustainability reporting framework on what issues to report and how to measure progress. The GRI standard offers great flexibility allowing reporters to demonstrate which issues are material to their organizations and only report on those material issues.
It’s helpful to chart it all out. Use the vertical axis to indicate the level of importance to stakeholders from low to high. Use the horizontal axis to indicate the potential impact on your organization’s success from low to high. One by one, place each issue in the appropriate area based on the information you gathered in the engagement process. Once it’s all laid out, you will have a nice visual representation of the issues that matter most to the success of your organization.
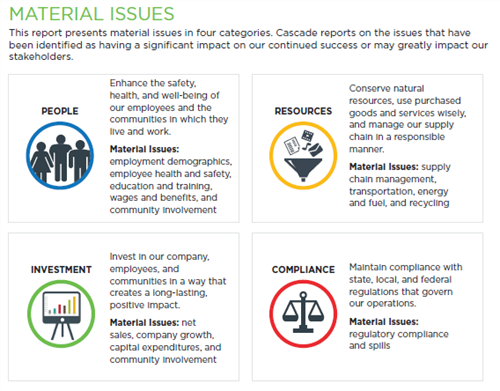
In my reporting experience, I’ve found it useful to organize the issues into broad materiality categories and create a goal statement for each category. This streamlining exercise enables the organization to focus resources and efforts in a handful of areas for maximum impact. Without this type of organization, the reporting task and sustainability effort, in general, can be daunting.

Make the Connection
Connecting the information gathered in the engagement process to actual data and issues included in your sustainability report shows your audience that you listened and, more importantly, acted on their concerns. The best sustainability reports detail the engagement process and offer readers the opportunity to continue the conversation.
Sustainability reporting is all about making these connections through the art of storytelling. Describe to your audience how and why each sustainability aspect was selected for inclusion in your report. Answer these questions:
- How does this issue impact the audience?
- How does it influence the success of your organization?
- How does it connect to the pillars of sustainability- environmental stewardship, social responsibility, economic prosperity?
- How is your organization working to improve performance on this issue?
Sustainability reports are often quite lengthy and include a lot of data. Remember to capture and retain the reader’s attention with images and visual content. Infographics are helpful to present data in a simple way. Photos of the people from your organization interacting with other stakeholders helps your audience to facilitate a human connection. A digital version with hyperlinks to supporting documentation or other reference resources encourages the reader to explore their own interests in further detail.
My Mom always told me the journey matters more than the destination. I’ve found that to be true in life. It’s also true about sustainability reporting.
To learn more Cascade’s sustainability journey, visit us and download our 2023 Corporate Sustainability Report at www.cascade-env.com/about-us/sustainability/.


